The Theory of Related-ivity: Segment VII
Monday, March 30, 2026 - 11:30

The Theory of Related-ivity:
A History and Analysis of the Best Related Work Hugo Category
by Heather Rose Jones
(This is a serialized article exploring the history of the Best Related Work Hugo category in its various names and versions. If you’ve come in at the middle, start here.)
Contents
Part 3: Historic Trends
3.1 General Trends
3.1.3 Gender
3.1.4 Authorship
Part 3: Historic Trends
3.1.3 Gender
Gender Fractions
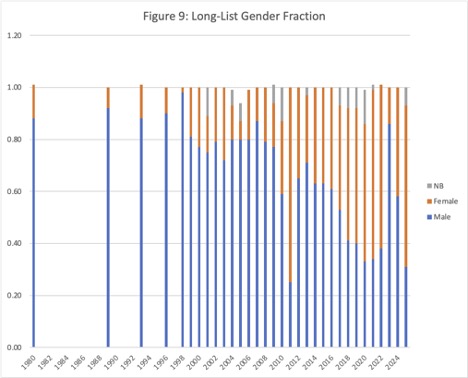
As the simplest way to present gender fraction data is in a bar graph, there is no convenient way to indicate the different eras in the figure. Remember that Non-Fiction is 1980-1997, Related Book is 1998-2009, and Related Work is 2010+. See Figure 8 and Figure 9 showing the overall gender fractions for each year for Finalist and Long List respectively
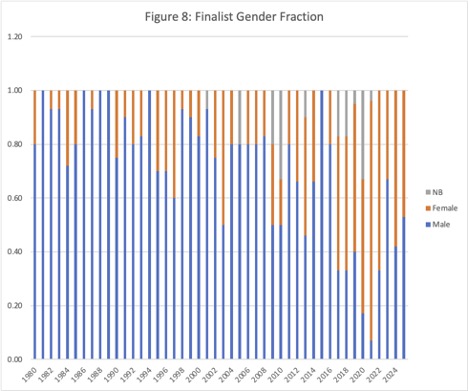
For Finalists, there is an overall shift from primarily male authorship during the Non-Fiction Book era, including 5 years with only male authors and no year when male authorship was less than 0.60, to occasional years of parity in the Related Book era (2 years with male authors at 0.50, but otherwise male authorship is nearly always 0.80 or higher), to overall parity during the Related Work era (6 years when male authors predominated, 7 years when non-male authors predominated, and 3 years nearly equal at 0.50 +/- 0.05). Outside of the Non-Fiction Book era, the only gender shut-out was in 2015 (a Puppy year) when all Finalists were male. In no year were all Finalists non-male, although 2020 came the closest with 0.50 female authors and 0.33 non-binary authors.
For the Long Lists, the overall trends are roughly similar, with a gradual increase in non-male authorship over time (with some years deviating from the trend). As might be expected, due to the larger data sets, year-to-year variability in this trend is less. The Finalist and Long List proportions are relatively similar. In 18 years, the difference between the two for male authorship is less than +/- 0.10. In 9 years, male representation is noticeably higher in the Long List than in the Finalists, while in 5 years male representation is noticeably lower in the Long List than among Finalists. The two years of greatest disparity between the two both involve lower male representation in the Long List (2011: male representation goes from 0.80 for Finalists to 0.25 in the Long List; 2015: male representation goes form 1.00 for Finalists to 0.63 in the Long List.).
If one takes the Long List as better representative of overall trends, three years stand out as breaking trend. 2011 with out-of-trend low male authorship (0.25), 2023 with out-of-trend high male authorship (0.86), and to a somewhat lesser extent 2024 with out-of-trend high male authorship (0.58).[1] With the exception of these three years, the year 2017 represents a tipping point when the Long List shifted from consistently male-dominated to consistently non-male dominated. This same year represents the point when the Finalist list shifted from being male-dominated (with occasional parity years) to primarily non-male dominated (with one exception). That is, out of the 46-year history of the category, something resembling gender parity has only been achieved within the last 9 years.
It may not be coincidental that this occurs immediately in the wake of the Sad Puppy years. That is, the campaign to promote “traditional” (i.e., male) nominees may have resulted in the opposite: a greater focus on works by women and non-binary authors.
There are three years for which more extensive nomination data is available and the gender proportion calculation was done on the complete set.[2] The resulting proportions are not significantly different from that of the Long List.
- 2007: Long List 0.87 male, all data 0.86 male (n=40)
- 2009: Long List 0.77 male, all data 0.74 male (n=25)
- 2010: Long List 0.59 male, all data 0.66 male (n=23)
The above analyses contrast male and non-male authorship,[3] but it’s worth taking a look at non-binary/gender-fluid authorship specifically. Non-binary authors first appear (in both the Finalist and Long List) in 2001 and, in the past 25 years, have appeared among Finalists in 10 years, and on the Long List in 12 years. The highest representation among Finalists is 0.33 in both 2010 and 2020. The highest representation in the long lists is 0.13 in the same two years. While this might seem like an unexpectedly high rate of representation, it’s worth noting that of the 19 works in my data set with non-binary/gender-fluid authorship, 12 involve the participation of one specific (highly-prolific) individual.
Proportion of All Male, All Non-Male, and Mixed Authorship
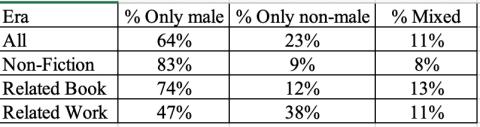
Another way of examining the gender data is to consider the percentage of works with all-male authorship (regardless of author number), percentage with all non-male authorship, and percentage with mixed-gender authorship. This is calculated only for the data set as a whole and for the individual eras. We see a similar pattern as for the gender fractions, with strong male dominance in the earliest era gradually giving way to something closer to parity, with mixed authorship holding fairly steady across all eras.
Table 1: Gender Proportions by Era
Gender of Topics
For a consideration of the gender of the subjects of Books, see the section for Other Tags in the chapter on People, which also examines repeat appearances for authors and Topics.
Overall Conclusions
The Best Related category has shifted over time from being strongly dominated by male authors, to shifting recently to a slighter balance toward other genders, though this is not consistent. This shift cannot be correlated specifically with the changes in the category name/definition, as it is gradual, but a key tipping point occurred in 2017.
Although it isn’t practical to do a cross-category survey as part of this study, there is evidence that a gender-related inflection point occurred in the fiction categories as well. James D. Nicoll surveyed gender-skewing within the fiction categories for the period up through 2019 by identifying years in which Finalists included either one or no male or female authors.[4] Low male representation is extremely rare in any of the 4 fiction categories up through 2010. There is a 3-year period from 2011-2013 when 1 or 2 of the fiction categories included only 1 male author, then another 3-year period form 2017 to 2019 (the last year in the survey) when at least 2 fiction categories included 0-1 male authors, culminating in all 4 fiction categories having only one male author in 2019. In contrast, prior to 2011 in 54 (out of 58) years at least one of the fiction categories had low female presence, and in the same period 49 (out of 58) years saw at least 2 fiction categories with low female presence. During the same couple of 3-year periods when some categories saw low male presence, no categories saw low female presence. (That is, it wasn’t just that women dominated in the specific categories with low male presence, but that they had more representation in all categories in those years.)[5]
3.1.4 Authorship
Unlike the fiction categories, it’s not uncommon for works in the Best Related category to have multiple authors. However, the way in which authorship is attributed for some of the non-Book formats isn’t always consistent. In the case of published works, the author list has sometime been revised from what is published at the Hugo website to reflect credited names in the original publication, however in the case of non-text works authorship is as attributed at the Hugo website.
Out of the 609 works in my data set, the number of listed authors is distributed as follows:
- 1 author: 448
- 2 authors: 108
- 3 authors: 27
- 4 authors: 8
- 5 authors: 4
- 6 authors: 1
- 32 authors: 1[6]
For an overall average of 1.19 authors per work, where 74% are single-author works. Because the vast majority are single-author works, a year-by-year analysis would be too granular to demonstrate any overall trends. Therefore, the data is grouped by era, then compared Finalists and full data sets (which may include more than the official Long List, but which is largely identical to Finalists for the Non-Fiction Book era).
Table 2: Number of Authors by Era
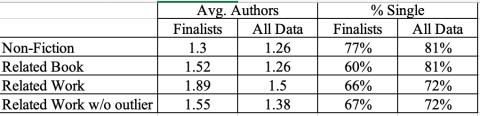
For Finalists, the average number of authors increases across the eras while the percentage of single-author works falls and then increases again. We may have a “Spiders Georg” problem here.[7] It is unusual for Best Related works created by a large team to include a full team roster.[8] If the one work that lists 32 authors is excluded, then we see only a minimal increase in average authorship between the Related Book and Related Work eras, while the percent single-author works is not substantially affected. Overall, this suggests that nominated works increasingly are involving (or at least crediting) larger teams.
When looking at the full data sets, the average number of authors is constant between the Non-Fiction and Related Book eras, then increases in the Related Work era (to a greater or lesser degree, depending on whether the outlier is excluded. This percentage of single-author works is also identical between the first two eras, then falls somewhat under Related Work. Taken all together, this suggests that the percent single-author Finalists in the Related Book era is the anomalous statistic. This appears to be due to multi-author works in the Related Book era still having a relatively small number of authors (2-3) in comparison to the Related Work era (see below).
In all subsets, Finalists have a higher average authorship and lower rate of single-author works than the full list, raising the possibility that there is a slight nomination bias in favor of multi-author works.[9]
Of the 13 works with 4-6 authors, 2 occur during the Non-Fiction era and the other 11 during the Related Work era (most of which were Finalists), with none occurring during the Related Book era. And of the 11 Related Works, 7 are a format other than a Book or Article.
This suggests that the expansion of scope to non-text formats (which may involve larger teams) in the Related Work era may be the driver for an increase in average authorship even as single-author works return to a higher level.
(Segment VIII will cover Part 3 Historic Trends, Section 3.2 Media, Chapter 3.2.1 Introduction.)
[1]. Given the specific years involved, it might be tempting to investigate whether this reflects a bias towards male authors on the basis of Chinese nominators, but the Chinese-language works show no such bias, therefore there is no basis for hypothesizing a gender bias with regard to the nomination of non-Chinese works by Chinese nominators.
[2]. Due to extensive ties at the low threshold for the Long List, some Long List data sets include up to 21 works.
[3]. See the Gender chapter in the Categorization Process section for the basis for categorization. To reiterate, as far as can be determined, all authors categorized as non-binary are assigned female at birth and are most likely to be perceived as female by an unknowledgeable observer. The question of the timing of when they shared their current identity publicly has not been investigated, therefore non-binary identity may have been retrospectively assigned for years prior to this being publicly shared.
[4] Nicoll, James D. September 10, 2019. “Gender and the Hugo Awards, by the Numbers” in Reactor Magazine (https://reactormag.com/gender-and-the-hugo-awards-by-the-numbers/) accessed 2026/02/26.
[5] A very rough back-of-the-envelope review of Finalists for the fiction categories in 2020-2025 indicates that in approximately ¾ of the category-year data sets, female-presenting authors were in the majority. So the author-gender inflection point for fiction appears to be sustained to the present.
[6]. This is not a typo. The r/Fantasy Bingo team was an extensive list. In recent years, it has become more normalized for large-team groups, especially publishing teams for Semiprozine, to list all staff individually.
[8]. For example, collections of Essays by a large number of people do not list all the contributors as “authors.”
[9]. If this is a genuine bias, there are multiple possible explanations. Multi-author teams might well be more likely to create higher quality works. Alternately, each team member might attract a different set of fans to the nomination process, increasing the likelihood of making Finalist. If this proposed “multi-author fanbase effect” is real, it may suggest that “non-traditional” works gain an advantage by involving larger creative teams than is practical for “traditional” text-based works. Plotting number of authors versus number of nominations does suggest something resembling a correlation for works with 2 or more authors, more so for works with 3 or more authors, and even more clearly when the analysis is restricted to finalists. However as the vast majority of high-nomination works have single authors, the phenomenon seems unlikely to affect nomination results significantly.
Major category: